

HAZ Meters
CERTIFIED FOR HAZARDOUS LOCATIONS
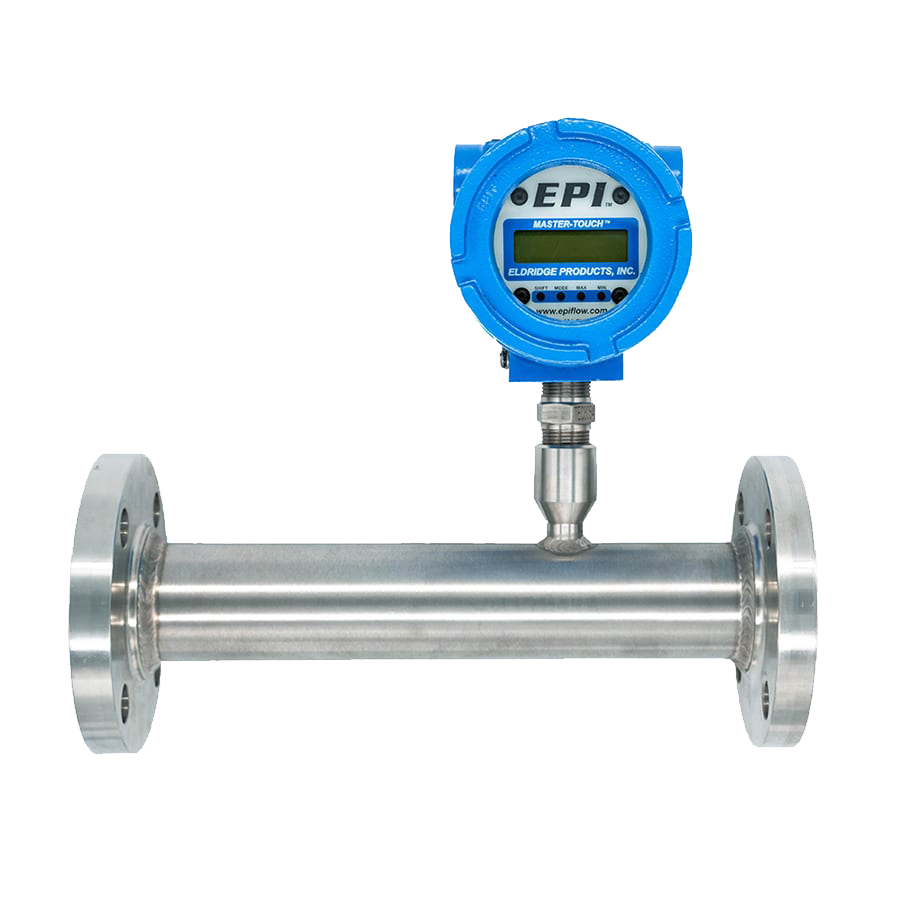
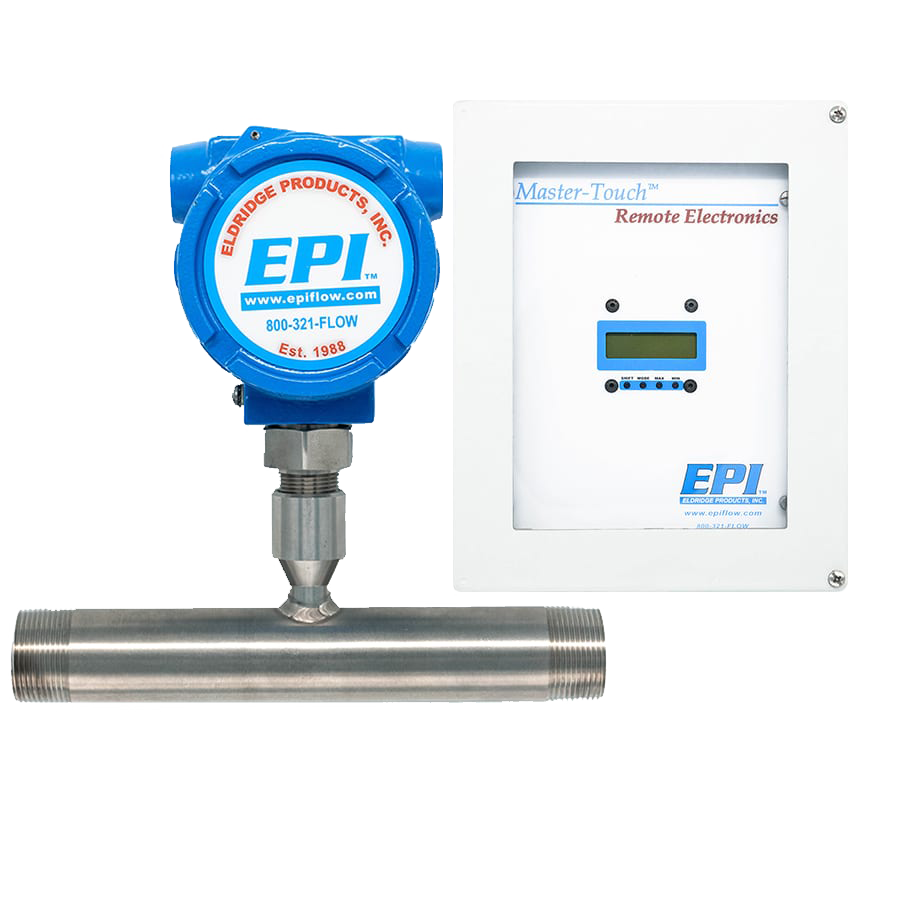
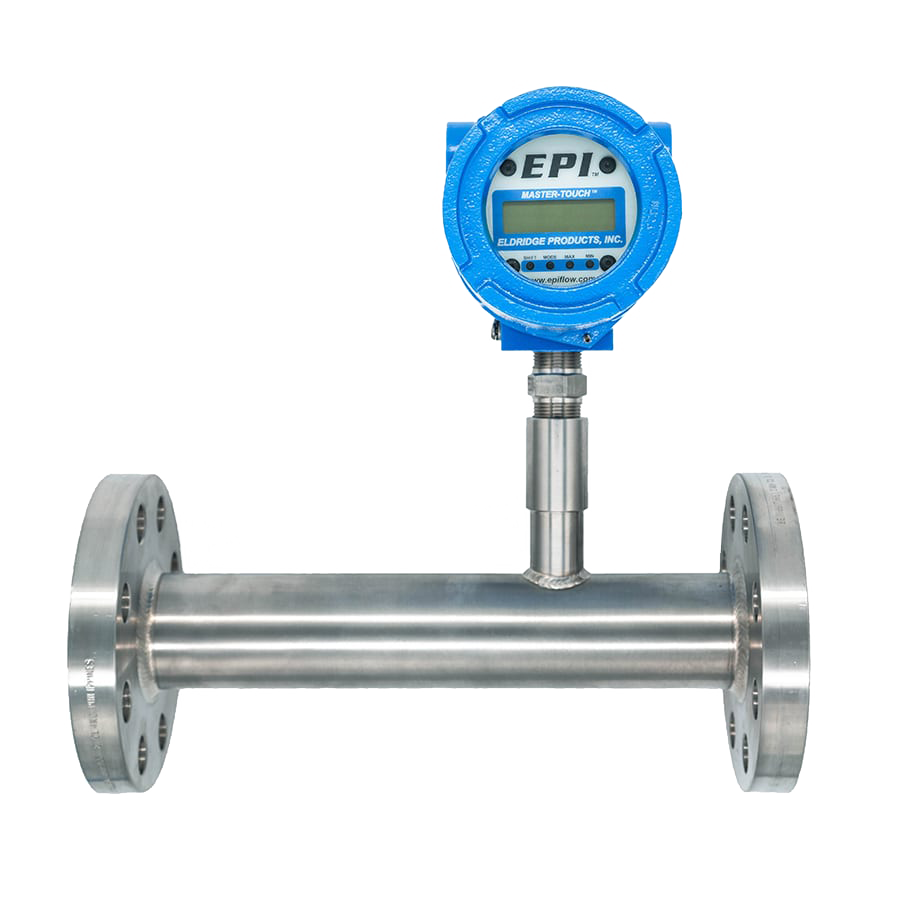
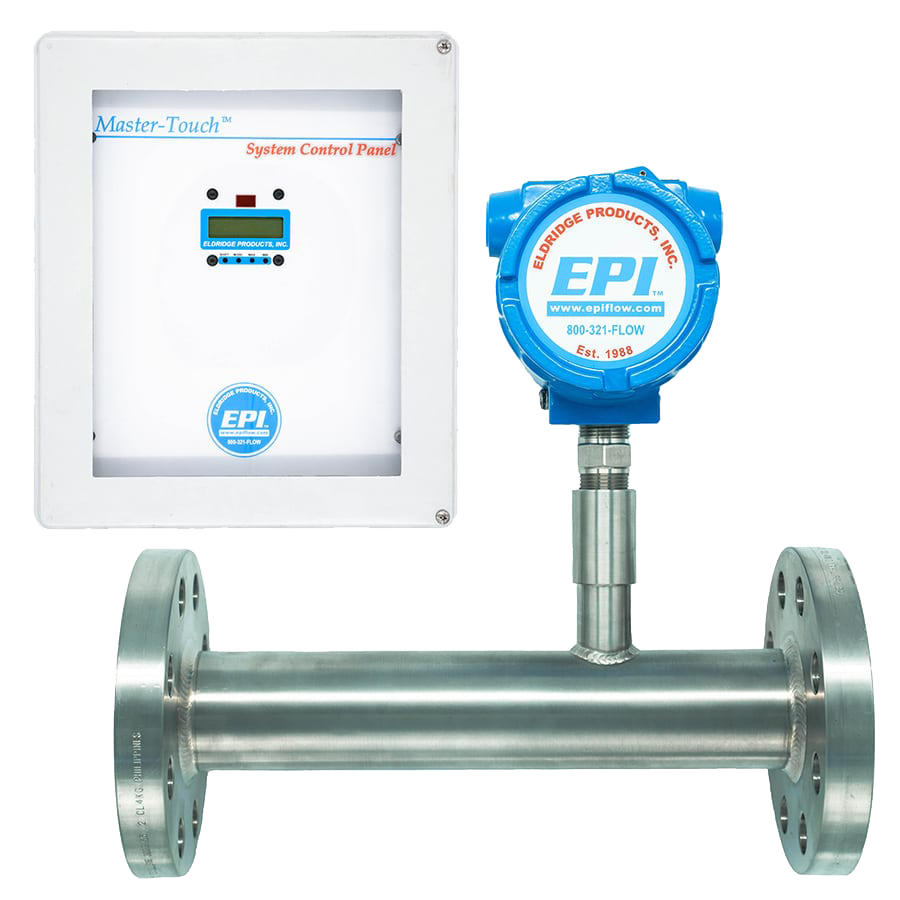
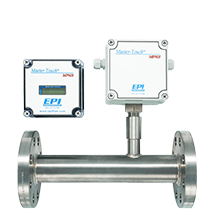
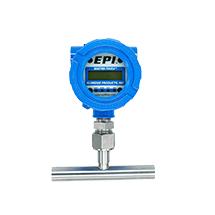
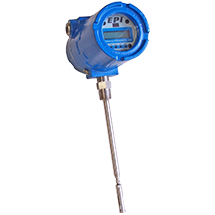
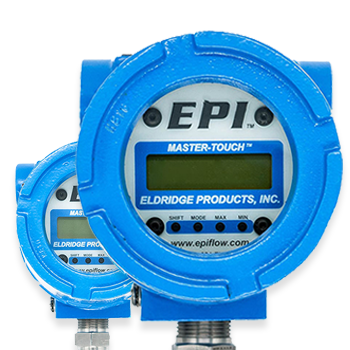
Our HAZ meters are certified for hazardous locations (flame-proof locations), with a diecast aluminum explosion-proof enclosure certified to CSA/CUS, ATEX, IECEx, and KOSHA standards. Assembled with stainless steel wetted materials (optional Hastelloy C-276®) the HAZ series is available in both Inline and Insertion configurations.
View EPI-HAZ Meters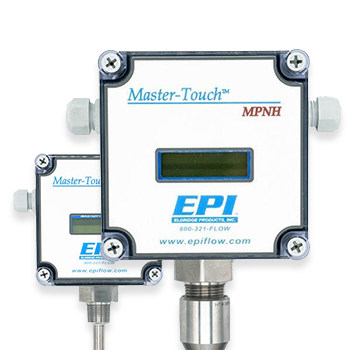
GEN Meters
CERTIFIED FOR GENERAL LOCATIONS
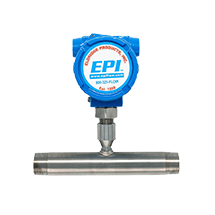
Our GEN meters are certified for use in ordinary locations (non-hazardous) and CSA/CUS Class 2252-03 & 2252-80 approved instruments. Assembled with stainless steel wetted materials (optional Hastelloy C-276®) the GEN series is available in both Inline and Insertion configurations.
View EPI-GEN Meters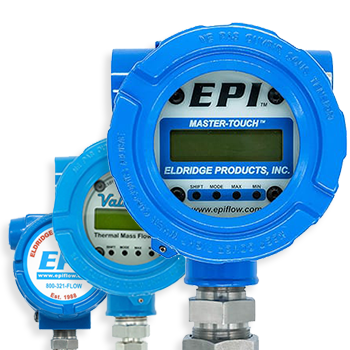
All Meters
FOR MULTIPLE APPLICATIONS
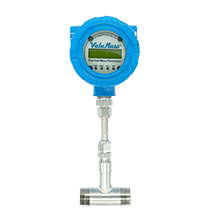
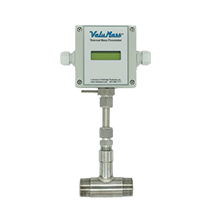
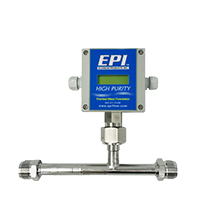
EPI offers gas measurement solutions for your high temperature (XT), high purity (PURE), and large duct (MultiGEN) applications. Additionally, our VAL series provides a more economical solution while maintaining the high standards that EPI has set for accuracy and reliability.
View All MetersDocuments & Downloads


Your Meter, Your Way
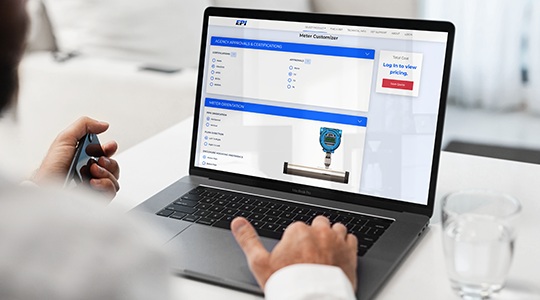
Introducing the New Meter Configurator
With the new EPI Meter Customizer, you can design the perfect flow meter for your application. Customize almost everything, including approvals, orientation, display options, communication options, and much more. When you’re finished, we’ll send you a customized quote in seconds!
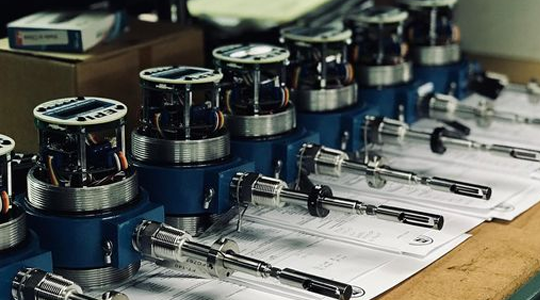
Start CustomizingHandcrafted Meters Designed Specifically for You
Every meter shipped by EPI is manufactured in the United States by a team of experienced specialists and goes through an extensive testing and calibration procedure before being signed off. Every effort is made to guarantee that all items are dispatched swiftly, precisely, and safely to your door.
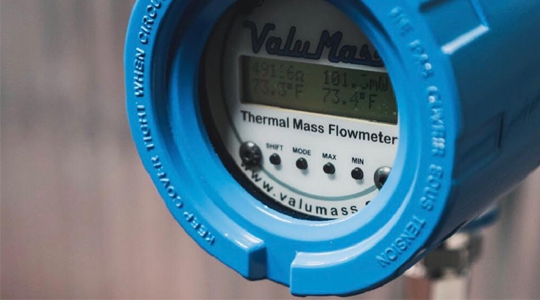
Demonstrating Precision and Durability
To imitate the circumstances of your process line, our flow calibration specialists use a range of gases. Every EPI flow meter includes a live zero validation that allows you to evaluate the meter calibration within a 2 percent -5 percent tolerance and ten years of technical assistance and remote help from our technical staff to guarantee your meter continues to exceed your expectations.
What Our Customers Are Saying
The Eldridge Products 9800 Series FAT flowmeters performed exactly as described. The MIT Reactor Laboratory installed two redundant probes in the 24-inch square duct that feeds 8000 CFM environmental air to our 150 ft. tall exhaust stack. One probe is centered in a 5 ft. horizontal run, while the other is centered in a 5 ft. vertical run. The vertical section is at the discharge of the blower and turns 90 degrees, which feeds the horizontal section and makes another 90 degree turn up into the stack. The velocity data must be accurate as it is used to calculate radioactive effluents at our reactor in the event of an accident. (which will never happen!) The data from both meters are in agreement despite the vertical meter located close to the blower discharge. I am very happy with our purchase and would recommend them to anyone needing accurate flow measurements in ductwork that may not be a linear run.
Anonymous
The FAT probe at our site is used for a pump and treat system which uses air stripping. We use the air flow meter to measure and achieve a specific air-to-water treatment ratio and we generally have air flows of up to 4,000 SCFM. The flow meter is placed between two treatment units with limited space and has functioned with minimal fluctuation in measurements (±100 SCFM) — We've had a good experience with the FAT probe at our treatment plant.
J. Raul Ramirez - Tetra Tech Inc.
What Sets EPI Apart

Unique Solutions
Thermal flow metering devices from EPI are entirely customizable. Begin personalizing yours today!
Exceptional Service
We provide the most excellent customer service in the business. Whatever you require, we are here to assist you in any way we can.

Quick Delivery
To guarantee that your meter arrives soon, the period between your order and our shipment is streamlined.

Long-Term Warranty
EPI offers a complimentary one-year warranty with every flow meter purchased. Extended warranties are available on our meter customizer.
30+
Years in Operation
USA
Made & Manufactured
10,000+
Meters Sold
Get In Touch

Email Us
General Information | : | info@epiflow.com |
Orders / Request Quote | : | sales@epiflow.com |
Service / RMA / Calibration | : | service@epiflow.com |
Technical Support | : | episupport@epiflow.com |
Media Request | : | media@epiflow.com |


Visit Us
Address | : | 465 Reservation Road Marina, CA 93933 |
Hours | : | Monday - Friday, |
About Eldridge Products, Inc.
EPI offers a comprehensive range of thermal equipment for measuring gas flow. Our flow meters and switches are recognized for their exceptional quality, dependability, ease of use, and longevity, thanks to over thirty years of expertise in thermal mass flow metering design and manufacture. You may learn more about what makes EPI unique on our About page.
About Us
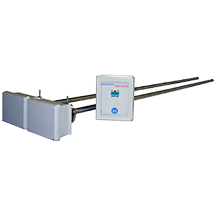
EPI’s Patented Flow Averaging TubeTM Technology
Our innovative Flow Averaging Tubes™ (FAT) directly calculates mass flow using convective heat transfer and is best suited to most applications with a limited straight run. The upstream straight run can be decreased to three diameters in many systems. Along the length of the upstream impact surface, the probe contains several large diameter entrance openings. The pressure at each entrance port is averaged inside the tube to produce the axial flow through the tube and over our flow sensor. The gas returns to the main flow stream through the ports near the detecting devices. Minor adjustments may be required to attain the best accuracy if there are anomalies in the real flow profile or installations in non-circular ducts.
Customize a MeterMore About EPI TechnologyWhat is a Thermal Mass Flow Meter, and How Does It Work?
Thermal mass flow meters detect mass flow directly using the convective heat transfer theory. Two ratiometrically matched, reference-grade platinum Resistance Temperature Detectors (RTDs) are used in EPI's unique thermal mass flow sensors. The platinum sensing element wire is encased in a 316 Stainless Steel sheath or a Hastelloy C sheath if one is required. Our intelligent sensor technology, which is controlled by a microprocessor, preferentially warms one RTD. At the same time, the other serves as a temperature reference. The heat from the first RTD is dissipated by the process gas flow, increasing the power necessary to keep an equilibrium between the RTDs. This rise is proportional to the molecular rate of flow of the gas. Our sensors are temperature adjusted for a wide range of process gas temperatures. As a result, they are unaffected by pressure fluctuations, resulting in a real mass flow rate indication of the output signal.
View Full GuideSee Industry Applications